Wildfire Frequency-Area Scaling Relationships
This post is the first of my contribution to JustScience week.
Wildfire is considered an integral component of ecosystem functioning, but often comes into conflict with human interests. Thus, understanding and managing relationship between wildfire, ecology and human activity is of particular interest to both ecologists and wildfire managers. Quantifying the wildfire regime is useful in this regard. The wildfire regime is the name given to the combination of the timing, frequency and magnitude of all fires in a region. The relationship between the frequency and magnitude of fires, the frequency-area distribution, is one particular aspect of the wildfire regime that has become of interest recently.
Malamud et al. 1998 examined 'Forest Fire Cellular Automata' finding a power-law relationship between the frequency and size of events. The power-law relationship takes the form:
where is the frequency of fires with size
  , and
, and  is a constant. is a measure of the ratio of small to medium to large size fires and how frequently they occur. The smaller the value of , the greater the contribution of large fires (compared to smaller fires) to the total burned area of a region. The greater the value, the smaller the contribution. Such a power-law relation is represented on a log-log plot as straight line, as the example from Malamud et al. 2005 shows:
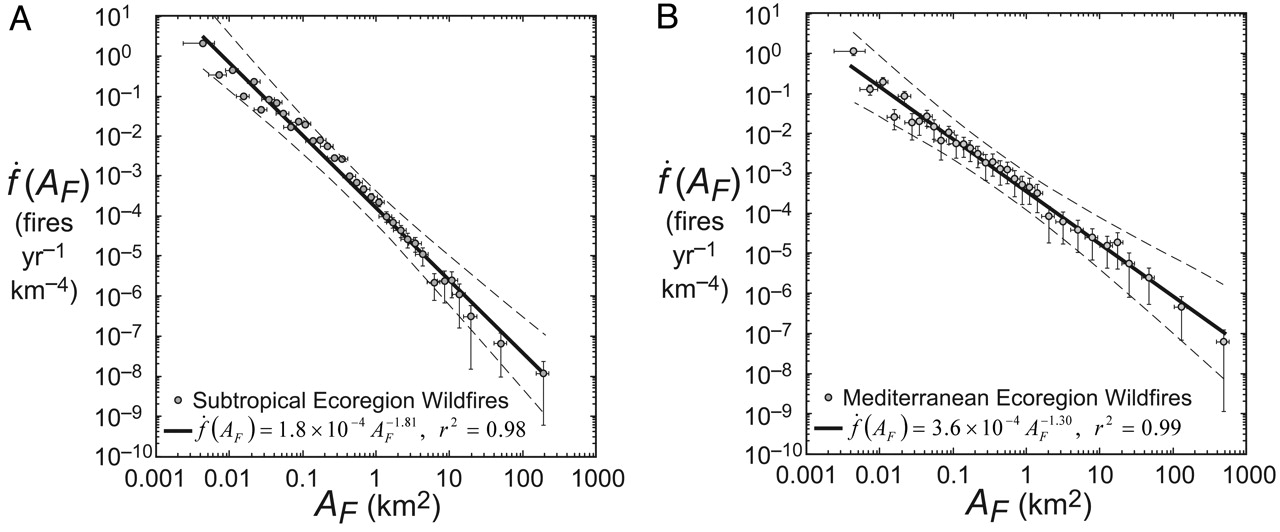
Shown circles are number of wildfires per "unit bin" of 1 km^2 (in this case normalized by database length in years and area in km^2) plotted as a function of wildfire area. Also shown is a solid line (best least-squares fit) with coefficient of determination r^2. Dashed lines represent lower/upper 95% confidence intervals, calculated from the standard error. Horizontal error bars on burned area are due to measurement and size binning of individual wildfires. Vertical error bars represent two standard deviations of the normalized frequency densities and are approximately the same as the lower and upper 95% confidence interval.
As a result of their work on the forest fire cellular automata Malamud et al. 1998 wondered whether the same relation would hold for empirical wildfire data. They found the power-law relationship did indeed hold for observed wildfire data for parts of the US and Australia. As Millington et al. 2006 discuss, since this seminal publication several other studies have suggested a power-law relationship is the best descriptor of the frequency-size distribution of wildfires around the world.
During my Master's Thesis I worked with Dr. Bruce Malamud to examine wildfire frequency-area statistics and their ecological and anthropogenic drivers. Work resulting from this thesis led to the publication of Malamud et al. 2005 which I'll discuss in more detail tomorrow.
Technorati Tags: wildfire, statistics, JustScience,
Wildfire is considered an integral component of ecosystem functioning, but often comes into conflict with human interests. Thus, understanding and managing relationship between wildfire, ecology and human activity is of particular interest to both ecologists and wildfire managers. Quantifying the wildfire regime is useful in this regard. The wildfire regime is the name given to the combination of the timing, frequency and magnitude of all fires in a region. The relationship between the frequency and magnitude of fires, the frequency-area distribution, is one particular aspect of the wildfire regime that has become of interest recently.
Malamud et al. 1998 examined 'Forest Fire Cellular Automata' finding a power-law relationship between the frequency and size of events. The power-law relationship takes the form:
where
Shown circles are number of wildfires per "unit bin" of 1 km^2 (in this case normalized by database length in years and area in km^2) plotted as a function of wildfire area. Also shown is a solid line (best least-squares fit) with coefficient of determination r^2. Dashed lines represent lower/upper 95% confidence intervals, calculated from the standard error. Horizontal error bars on burned area are due to measurement and size binning of individual wildfires. Vertical error bars represent two standard deviations of the normalized frequency densities and are approximately the same as the lower and upper 95% confidence interval.
As a result of their work on the forest fire cellular automata Malamud et al. 1998 wondered whether the same relation would hold for empirical wildfire data. They found the power-law relationship did indeed hold for observed wildfire data for parts of the US and Australia. As Millington et al. 2006 discuss, since this seminal publication several other studies have suggested a power-law relationship is the best descriptor of the frequency-size distribution of wildfires around the world.
During my Master's Thesis I worked with Dr. Bruce Malamud to examine wildfire frequency-area statistics and their ecological and anthropogenic drivers. Work resulting from this thesis led to the publication of Malamud et al. 2005 which I'll discuss in more detail tomorrow.
Technorati Tags: wildfire, statistics, JustScience,
Labels: Academic, Ecological, Environmental, Modelling, Publications, Statistical, Wildfire

This work by James D.A. Millington is licensed under a Creative Commons Attribution-Noncommercial-Share Alike 3.0 United States License.
posted by James at Monday, February 05, 2007
![]()
![]()


0 Comments:
Post a Comment
<< Home